
Loudoun County's unemployment rate was 3.4% in September, up from 3.2% a year ago. About 5,800 fewer residents had jobs, and the labor force fell for a second year.
Loudoun County’s unemployment rate was 3.4% in September, up from 3.2% in September 2025. Two years ago it was 2.6%.
The bigger change is in how many residents are working. About 235,890 Loudoun residents had jobs in September. That is about 5,790 fewer than a year earlier and about 9,520 fewer than in September 2024.
The figures are the preliminary September estimates from the U.S. Bureau of Labor Statistics’ Local Area Unemployment Statistics for Loudoun County. They count residents by where they live, not where they work, so they cover Ashburn households whether people work at a data center down the road or commute into Washington. The figures are not seasonally adjusted, so the fair comparison is with the same month a year earlier.
The numbers
| Loudoun County | September 2026 | September 2025 | September 2024 |
|---|---|---|---|
| Unemployment rate | 3.4% | 3.2% | 2.6% |
| Residents working | 235,890 | 241,678 | 245,406 |
| Residents out of work and looking | 8,312 | 7,912 | 6,605 |
| Labor force | 244,202 | 249,590 | 252,011 |
The rate was the same as in August, also 3.4%. The counts come from the BLS series for employment, unemployment and the labor force.
A second year of fewer workers
Loudoun’s labor force, residents who are working or looking for work, fell by about 5,390 in a year. It also fell between September 2024 and September 2025.
That is the first time it has shrunk two Septembers in a row since the BLS county series began in 1990. The only other September falls were in 2010 and 2020. The number of residents with jobs is the lowest for a September since 2021.
The BLS figures do not say why people left the labor force. Some may have moved away, retired or stopped looking for work.
The highest September rate in years
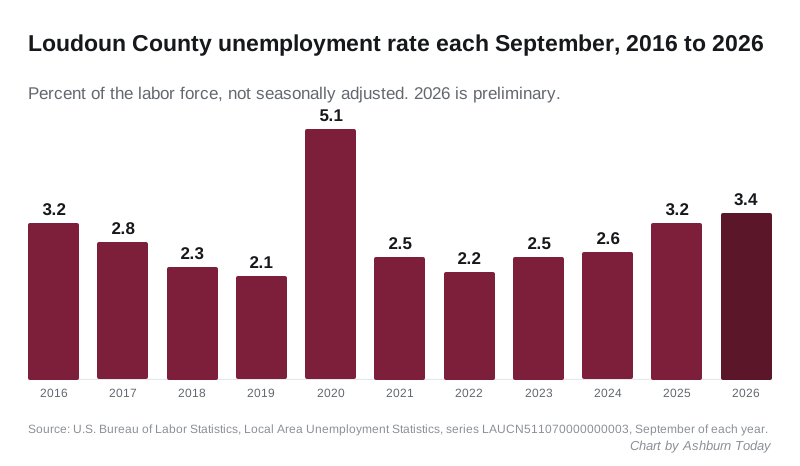
September’s 3.4% matches September 2015. Leaving aside 2020, when the pandemic pushed the rate to 5.1%, it is the county’s highest September rate since 2014, when it was 4.1%.
The rate is still low by national standards. The U.S. rate on the same unadjusted basis was 4% in September, and Virginia’s was 3.6%.
Loudoun against its neighbors
| Area | September 2026 | September 2025 | Residents working, change in a year |
|---|---|---|---|
| Arlington County | 2.9% | 3% | down 3,936 |
| Loudoun County | 3.4% | 3.2% | down 5,788 |
| Fairfax County | 3.4% | 3.3% | down 16,406 |
| Prince William County | 3.5% | 3.3% | down 6,583 |
| Virginia | 3.6% | 3.4% | |
| United States | 4% | 4.3% |
Every Northern Virginia county in the table had fewer residents working than a year earlier. The county figures come from the BLS series for Fairfax County, Prince William County and Arlington County.
What it means for you
- Looking for work? Loudoun County runs free job search workshops. The November sessions are listed on the county calendar.
- Lost a job? Unemployment insurance claims in Virginia go through the Virginia Employment Commission.
- Watching home prices? Our Ashburn home prices page tracks typical values each month.
The BLS releases October’s county figures in early December. September’s numbers may be revised then.
Have your say